Data Science Examples
Here is PDF with the three Power BI samples below.
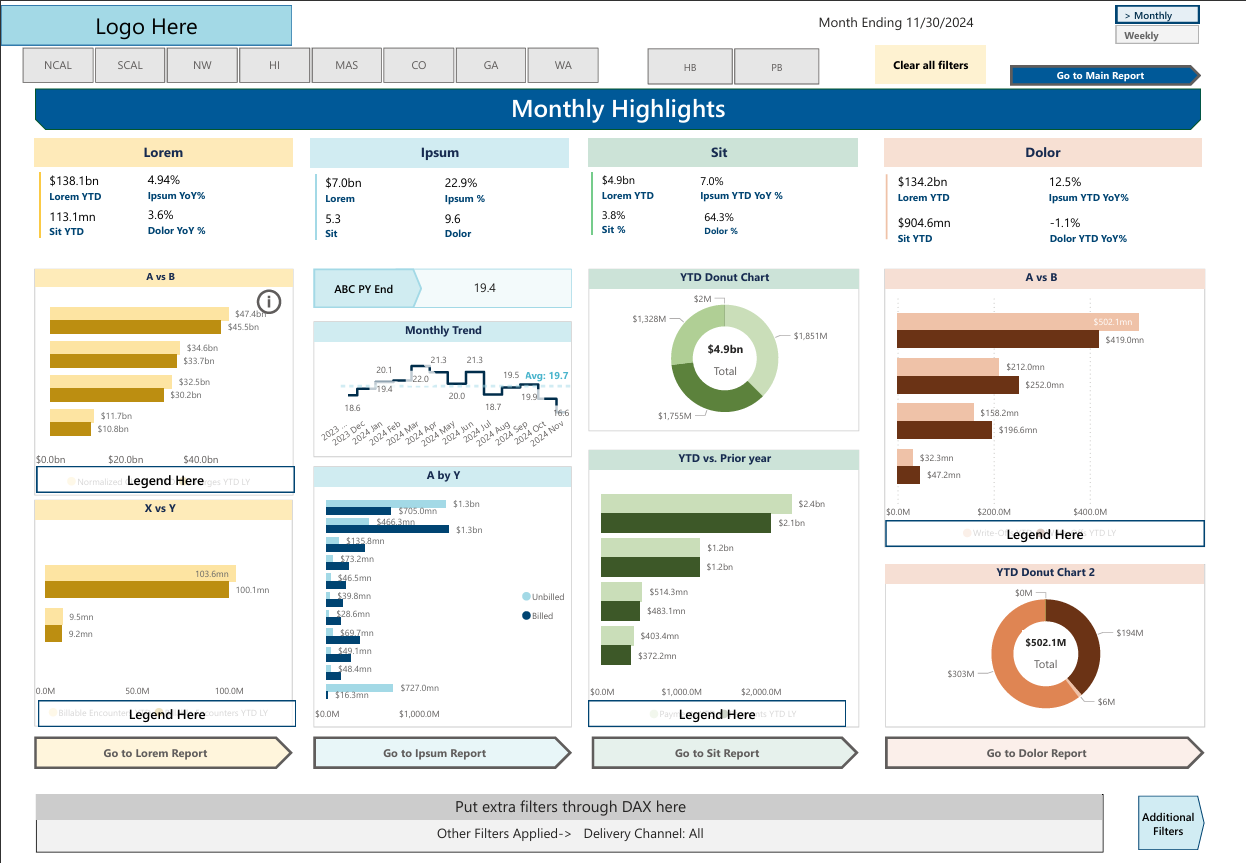
Power BI Executive Monthly Highlights Dashboard
This is an anonymized Executive Dashboard.
Best Practices for this include:
* Simple color scheme that still separates parts and visualizations
* High level data optimized for speed – executives need high performance
* Buttons that lead to more reports
* Date of data refresh visible on this and all pages
* All selected filters can be seen on screen or a PPT export
Reports for Analysts – Best Practices
making_reports_for_analysts - presentation
Alternate file download here
Report I made for a Non-Profit
non_profit_report_with_disparate_datasets
Alternate file download here
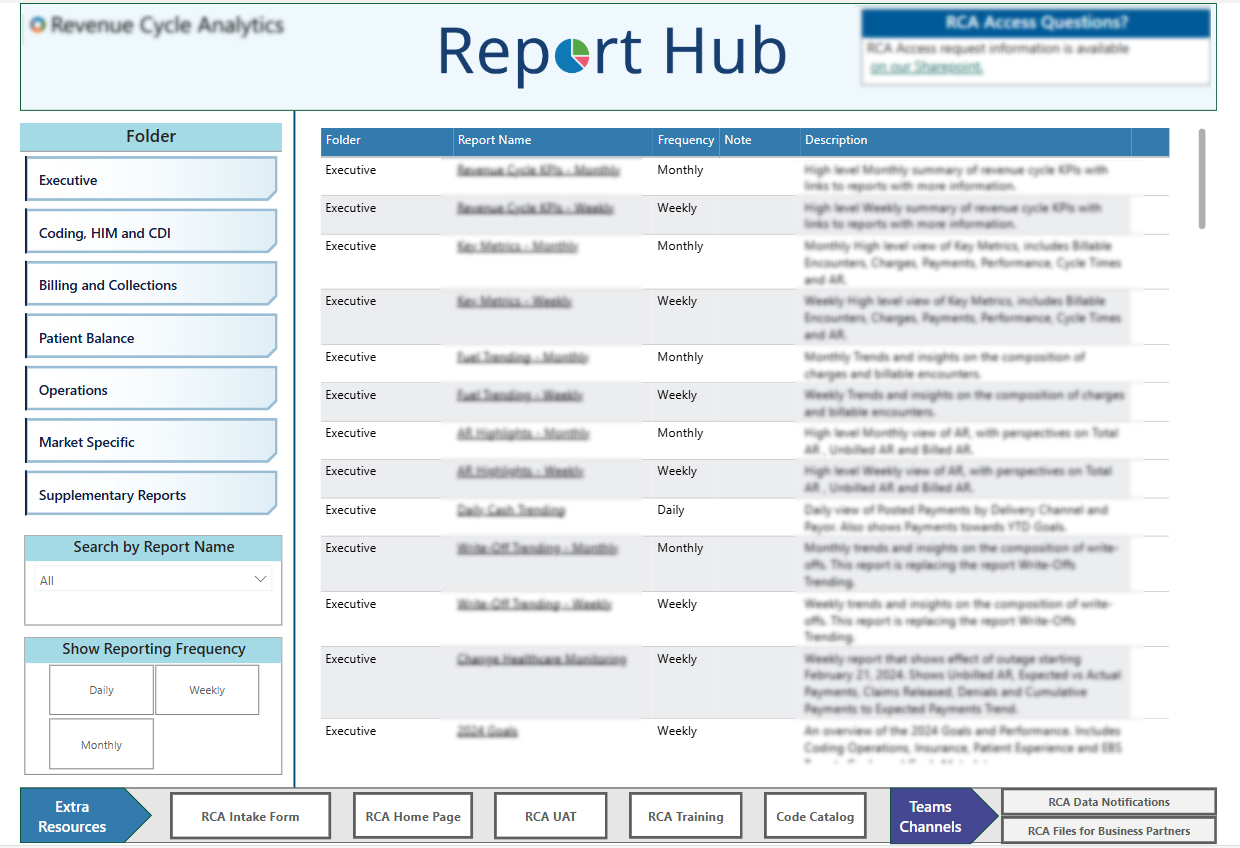
Searchable database of Reports
Here is a directory of Power BI reports I made in Power BI
With a little help from Excel of course! Our team had many reports, and Business Partners needed a way to find the reports. So I made a basic table in Excel with Report Names, URLs, descriptions and other metadata. Then I gave it a name and a logo – and the Business Partners could find what they were looking for. Additionally I put buttons to our SharePoint, Teams channel and other places at the bottom.
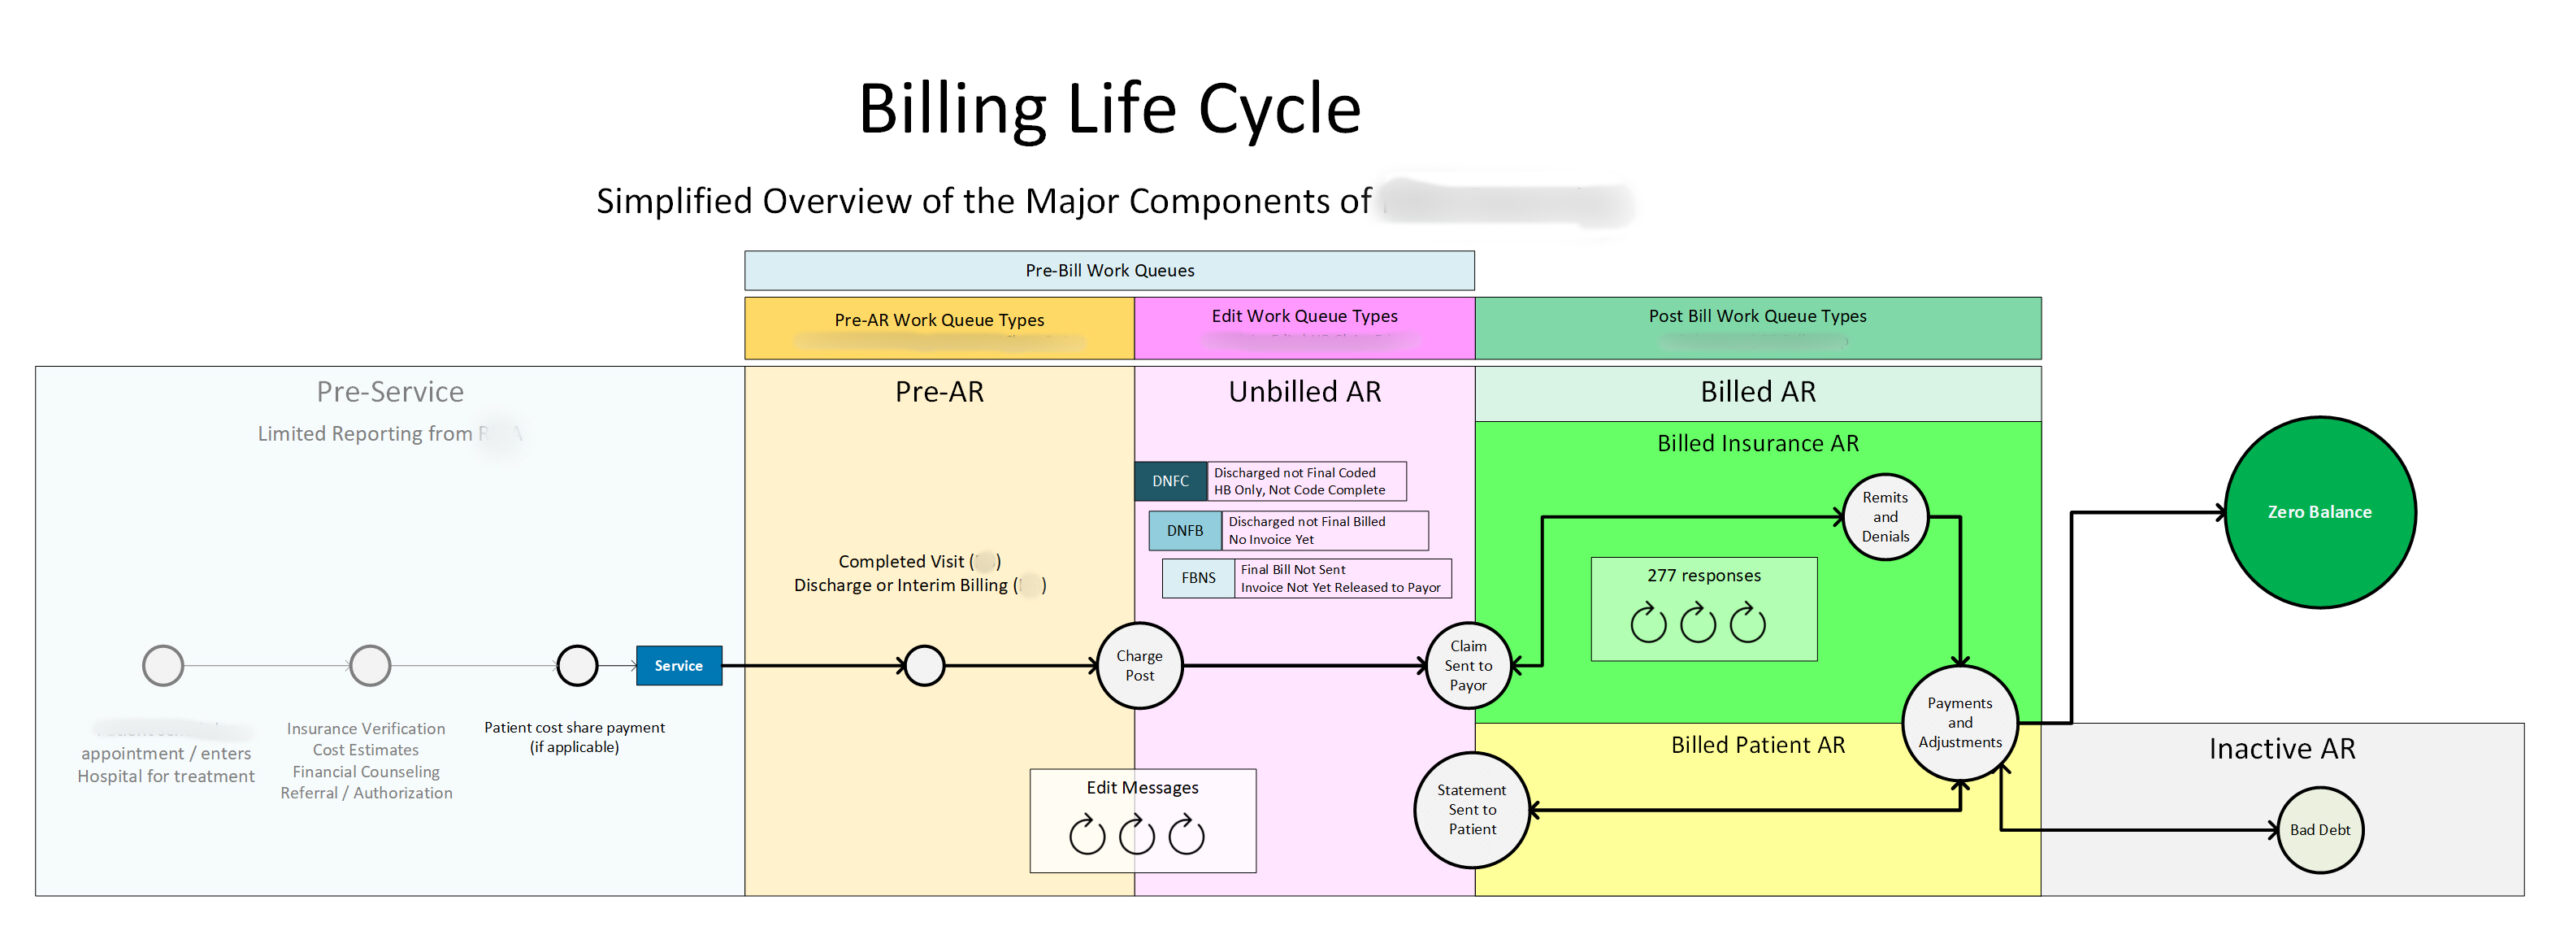
Financial Documentation – Healthcare Revenue Cycle
Here is a chart I made to illustrate the Revenue Cycle
I made this chart in Visio to show the Healthcare Revenue Cycle – from Check in to AR to Bad Debt and Zero Balance. You can download a high resolution version of this file here.
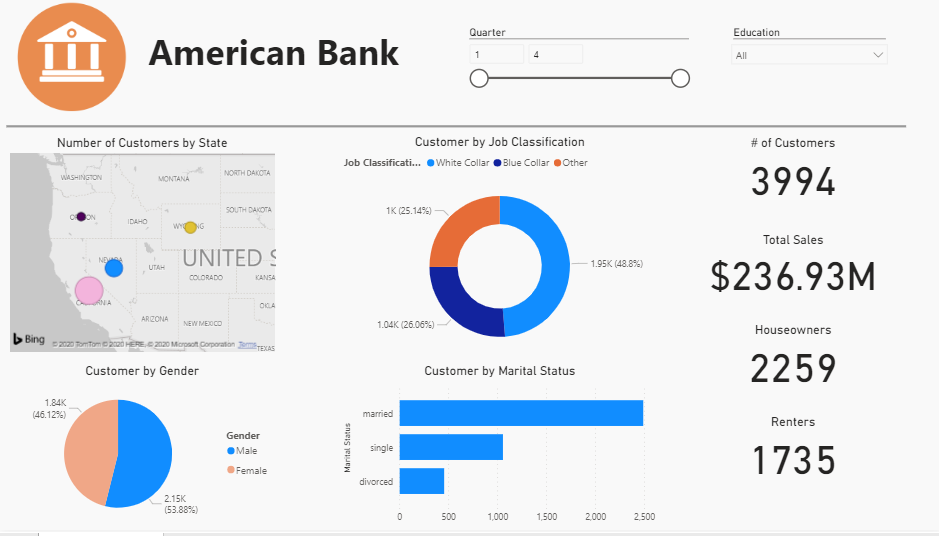
Power BI Dashboard
Here is a dashboard I made in Power BI awhile ago.
It includes –
- 4 data displays
- 2 slicers, and
- 4 cards
Download a screenshot here.
Excel, VBA, Financial Analysis and Accounting
I really like Excel – there are many Data Analytics programs out there, but you would be surprised at how far you can get with Excel.
Here are three files:
- An Excel File I keep, filled with examples of Models, Pivot Charts and Tables, Vlookup and more. You can get it here.
- A Macro file I made with VBA that Adds and formats headers to as many worksheets as you have, sums the total of the last row in each worksheets, and pastes the worksheets in an empty worksheet at the end. You can download the zipped XLSM file and text file of the Visual Basic code here.
- Here is a Financial Analysis spreadsheet I made – it covers the basics of Financial Analysis and Accounting. You can find it here.
Be sure to enable Macros in the Excel file so that you can run the Macros.
Tableau
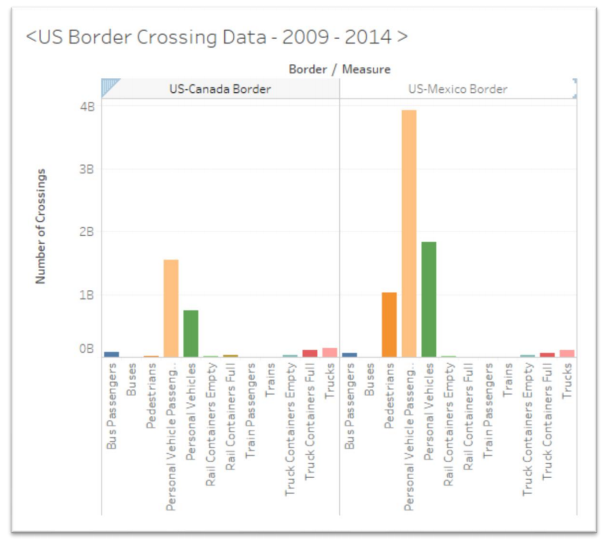
Here is a report I did with Tableau.
I analyzed a big dataset with Tableau, and came to some conclusions.
Download the report here.
Data Visualization
Here’s a blog post I made for a Startup. You can download the PDF of the blog post here.
SQL

I like PostgreSQL, and have a local pgAdmin setup on my computer.
You can find a list of my favorite PostgreSQL queries here.
